
June 27 – July 27, 2024 @ Smøla, Frøya and Ytre Vikna
The land use challenge of onshore wind energy
As global energy production shifts towards renewables to meet climate goals, onshore wind energy has become widespread. However, despite their low carbon footprint, onshore wind power plants require significant land resources.
While a single wind turbine takes up little space, spacing requirements in between turbines, road networks within the power plant, and landscape modifications for safe road and turbine placement, result in a high land use at project level.
Onshore wind energy has one of the highest land use requirements of all renewable energy sources, potentially needing up to six times more area than ground installed solar panels, for example. This large area footprint comes with a high risk to impact ecosystems, potentially causing ecosystem degradation by altering habitats and changing species composition. We can differentiate between direct and indirect impacts.
Direct impacts occur when land is permanently cleared to build infrastructure such as turbines and roads, which directly alters the landscape by removing vegetation. Indirect impacts do not require the direct clearing of land but extend across a broader area. They include for example soil compaction from heavy machinery, changes in water flow due to drainage, and shifts in the local microclimate caused by wind turbine operation.
As onshore wind energy continues to expand, understanding and mitigating its impacts on ecosystems is crucial for balancing renewable energy production with ecosystem conservation.
Understanding the ecological impacts of onshore wind energy
Although this expansive land use raises concerns about ecosystem degradation, our understanding of the ecological impacts of onshore wind energy remains limited and imbalanced.
Most existing studies concentrate on wildlife disturbances during the operational phase, such as collisions with birds or bats. In contrast, few studies have addressed the impacts of other project phases, like construction and decommissioning, or assessed long-term changes in foundational ecosystem components like vegetation, soil, and hydrology.
To address these knowledge gaps, studying vegetation at wind power plants offers a critical path forward in understanding how onshore wind energy affects ecosystems over time. By analysing how vegetation responds to and recovers from wind energy development, we can develop strategies to help mitigate adverse effects and restore degraded ecosystems. These findings can ultimately guide future wind energy projects to support both renewable energy goals and environmental conservation.
How we sampled vegetation at Norwegian wind power plants
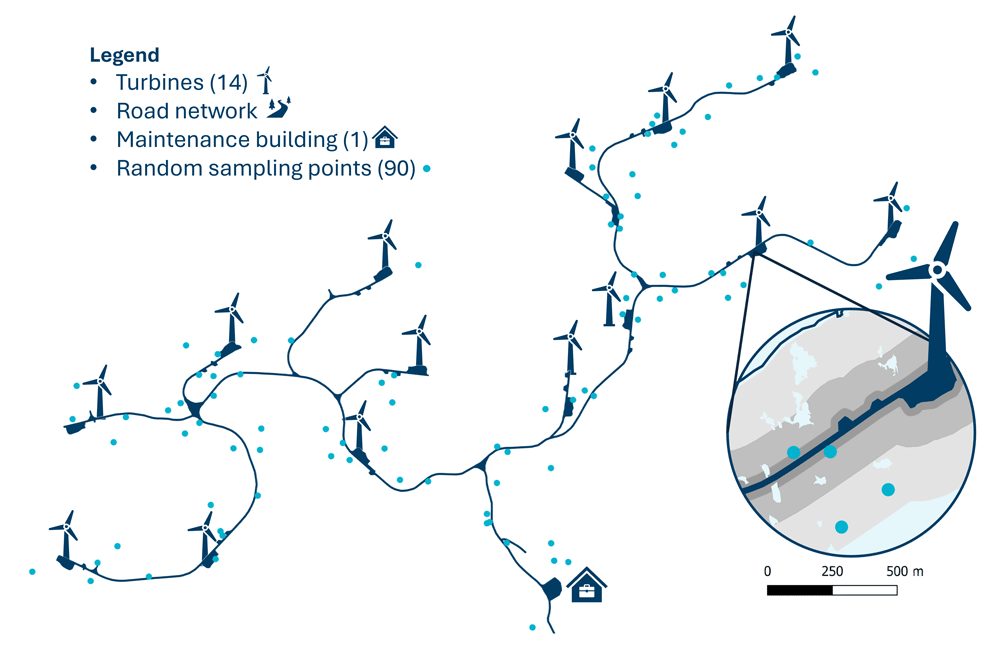
Building on these objectives, we conducted vegetation studies at three different wind power plants in Norway, located on the islands of Smøla, Frøya, and Ytre Vikna. Built roughly a decade apart, these sites allowed us to examine vegetation recovery over different time spans. This is under the assumption that these sites exhibit similar vegetation communities due to similar climatic and geological conditions.
At each site, we randomly selected 90 sampling points, categorised into three zones based on their distance to turbines and roads: Zone 1) 0-10m distance, Zone 2) 10-50m distance, Zone 3) 50-120m distance. This is illustrated in the figure below. By placing 30 points in each zone, we could observe vegetation changes across a gradient from high-disturbance areas near infrastructure to lower-disturbance areas further away.
Recording vegetation changes at Norwegian wind power plants
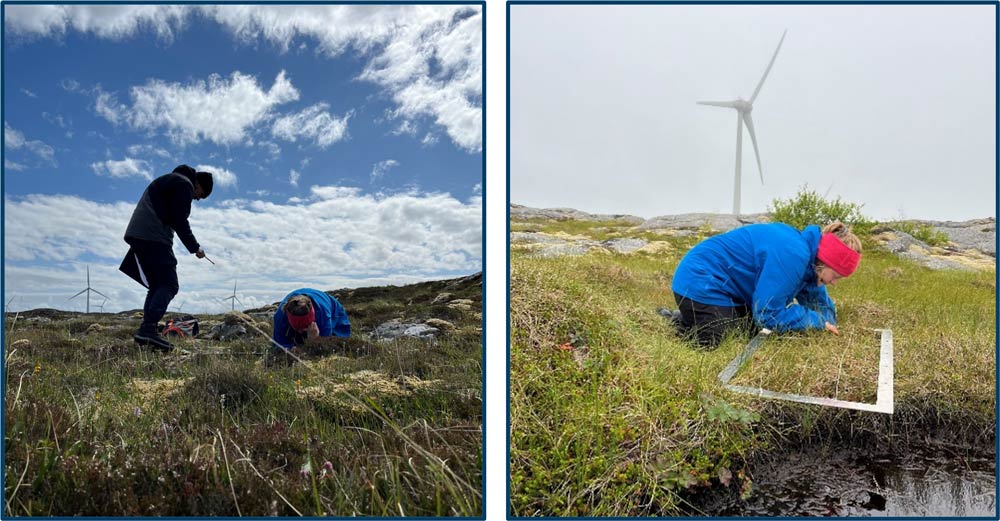
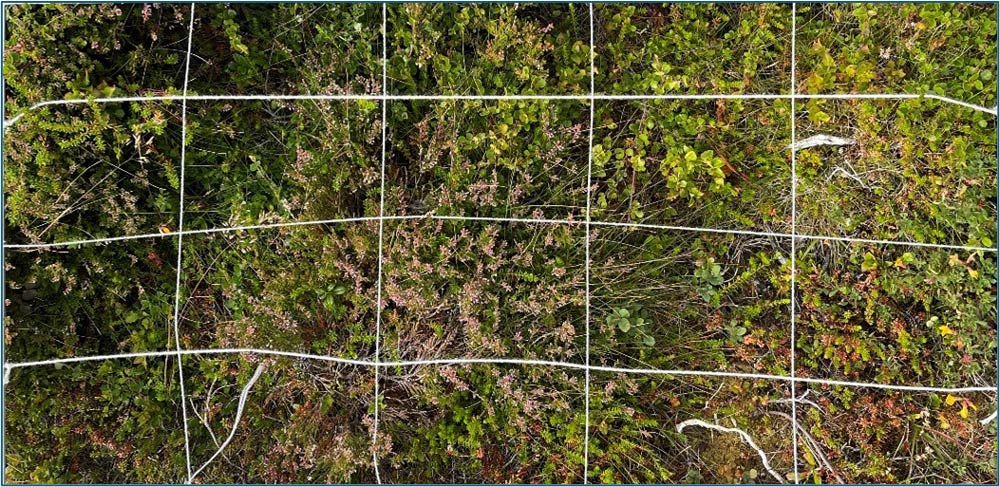
At each sampling point, we estimated the coverage of bare soil or crushed rock as indicators for disturbance. We recorded all visible vascular plants, mosses, and lichens using 0.5m² vegetation frames divided into 20 sub-frames. We estimated the abundance of each species by noting its presence or absence within each of the 20 sub-frames.
Using species trait data, we classified species based on their ecological strategies, with a focus on ruderal and invasive species. Ruderal species are plants that quickly colonise disturbed areas. They are typically fast-growing and resilient to stress, which enables them to outcompete native plants. This disrupts natural plant communities and ecological processes. Monitoring the presence of ruderals and invasive species is essential, as their spread can alter ecosystem functioning over time.
Ruderal species are plants that thrive in disturbed environments, like roadsides, construction sites, or areas cleared by human activity. These plants are nature’s quick responders, adapted to grow fast and colonise bare ground before other species can establish themselves. While they help stabilise soil and prevent erosion, ruderal species can displace native plants by outcompeting them for resources like sunlight, water, and nutrients, potentially disrupting local ecosystems.
Initial findings: Evidence of vegetation disturbance at wind power plants
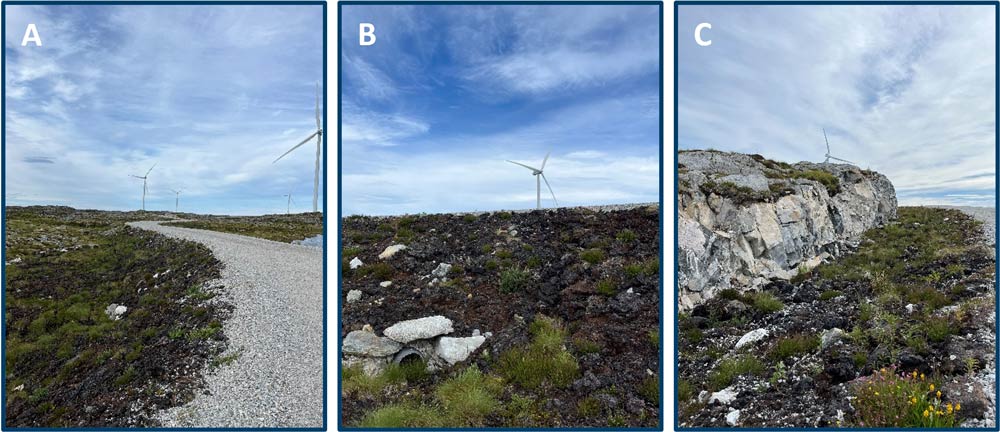
At Frøya, the newest wind power plant, which started operation in 2021, we documented several disturbances near the associated infrastructure (as shown in the pictures below). Close to the roads, large areas of bare soil and crushed rock indicated recent construction activity (picture A). In some sections, culverts were installed beneath the roads to allow water flow, likely disrupting natural water pathways (picture B). In rocky areas, we found signs of rock blasting leaving deposits (picture C).
Unlike at the two other sites, the roads at Frøya were generally wide and elevated, with steep, sparsely vegetated roadsides. These features created a sharp contrast with the surrounding landscape.
Comparing vegetation recovery across wind power plants
Our initial findings reveal differences in vegetation recovery across the three sites. At Smøla, the oldest site, vegetation cover has largely rebounded, and species diversity near roads was often higher than in undisturbed reference plots. However, a high abundance of ruderal species close to roads suggests a shift in species composition following initial disturbances
At Ytre Vikna, vegetation recovery appeared moderate, with a mix of native and ruderal species. Frøya, the most recent site, still showed extensive bare soil and crushed rock, with limited vegetation colonization so far. Both species diversity and abundance in disturbed plots at Frøya were generally lower than in undisturbed plots, farther away from roads and turbines.
In the future, we aim to assess whether the plots in disturbed areas resemble natural plant communities or have shifted toward different community structures. This will involve examining plant traits and evaluating if there is an increase in ruderality, meaning a higher presence of ruderal species in disturbed areas. These insights will help determine whether mitigation actions are necessary, and if ecosystem restoration efforts should be implemented to support long-term recovery.
Using indicator species to assess ecosystem recovery
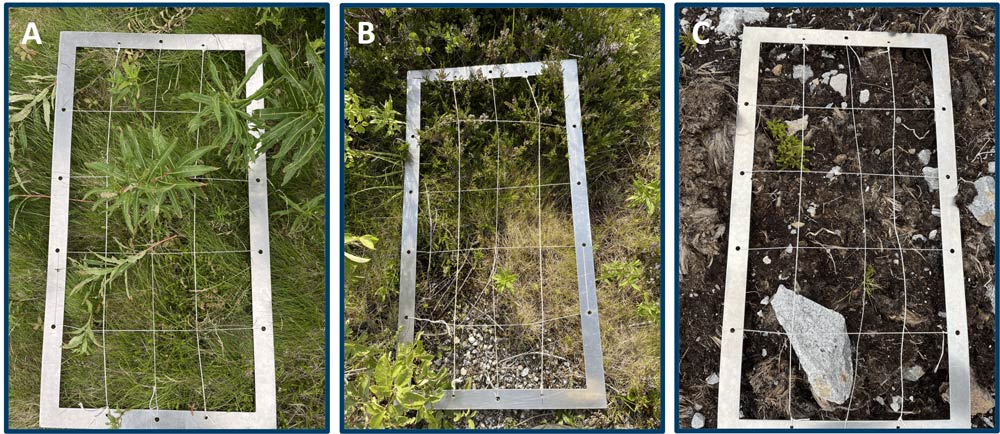
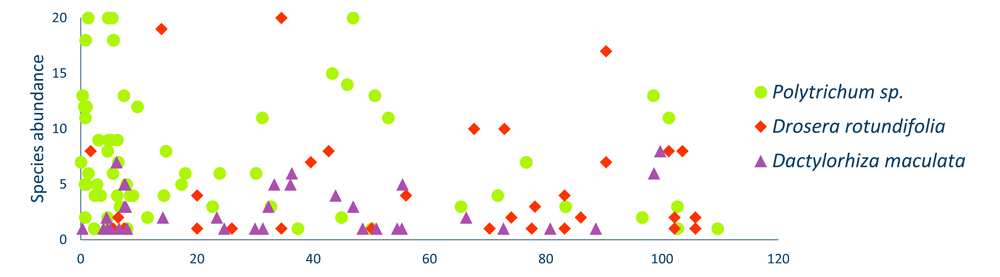
Certain species can provide valuable insights into the state of an ecosystem, including its recovery after disturbances. Drosera rotundifolia (in circle A, below) is a carnivorous plant commonly found in nutrient-poor wetlands. By capturing insects, this plant plays a role in balancing nutrient levels in bog ecosystems and can be used as an indicator for undisturbed, healthy bog ecosystems. We found that the Drosera rotundifolia was most frequently present in undisturbed plots, farther away from roads and turbine pads. In contrast, the species was less frequently found in plots from the disturbed zone closer to roads.
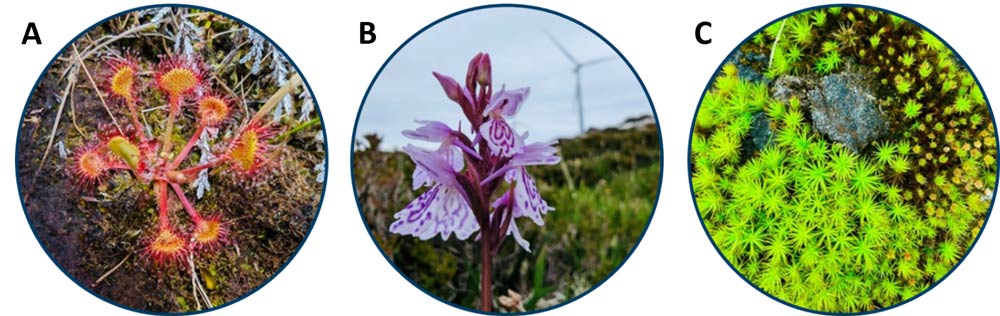
Dactylorhiza maculata (circle B, above) is an orchid that provides nectar for bees and butterflies, and usually thrives in stable habitats. Orchids like Dactylorhiza maculata are rare and valuable to conserve, as they contribute unique biodiversity and support pollinator networks. Surprisingly, we found this species to be equally abundant in disturbed and undisturbed areas, and throughout different levels of disturbance (as shown in the graph below). However, the spread of ruderal species could threaten this species’ persistence over time. ¨
Polytrichum mosses (Bjørnemoseslekta, in circle C, above) indicate early successional stages and can be a sign of disturbance, as they readily colonise exposed soils after degradation. However, by stabilising soil and retaining moisture, they can contribute to habitat recovery. We found that Polytrichum mosses were most frequent in the highly disturbed zone (0-10m distance to infrastructure), and less often found in plots from the undisturbed area (as shown in the graph below).
Balancing wind energy expansion and ecosystem conservation
Our study highlights the ecological impact of wind energy development on vegetation and underscores the importance of sustainable practices in preserving coastal ecosystems in Norway. While ruderal species may quickly recolonise disturbed areas, they can alter ecosystem composition by outcompeting local species. To promote ecosystem health alongside renewable energy goals, future wind energy projects should incorporate practices that limit the spread of ruderal species and support the recovery of local vegetation, balancing renewable energy expansion with ecosystem preservation.


